Commercial Statistical software DEMO’s
One or more of these programs have been purchased by 140 companies, consultants, and institutions since 2001.
To purchase NON-demo, fully functioning, commercial versions of these software, send email request to JOHNZORICH@YAHOO.COM
Payment can be by hardcopy check or via PayPal
Reliability Statistics Basics
Version 17 — This program applies to variables and attribute data. It can calculate… Sample size; %Confidence; %Reliability (= % In-specification); Normal Distribution K-factors; Stress/strength interference; Confidence limits on Cpk, Ppk, MTTF, and MTBF; Normal probability plots; Transformations to normality. SIGNED VALIDATION REPORT IS PROVIDED FREE WITH PURCHASE ($195). Purchased by 70 companies since 2002.
Reliability Plotting
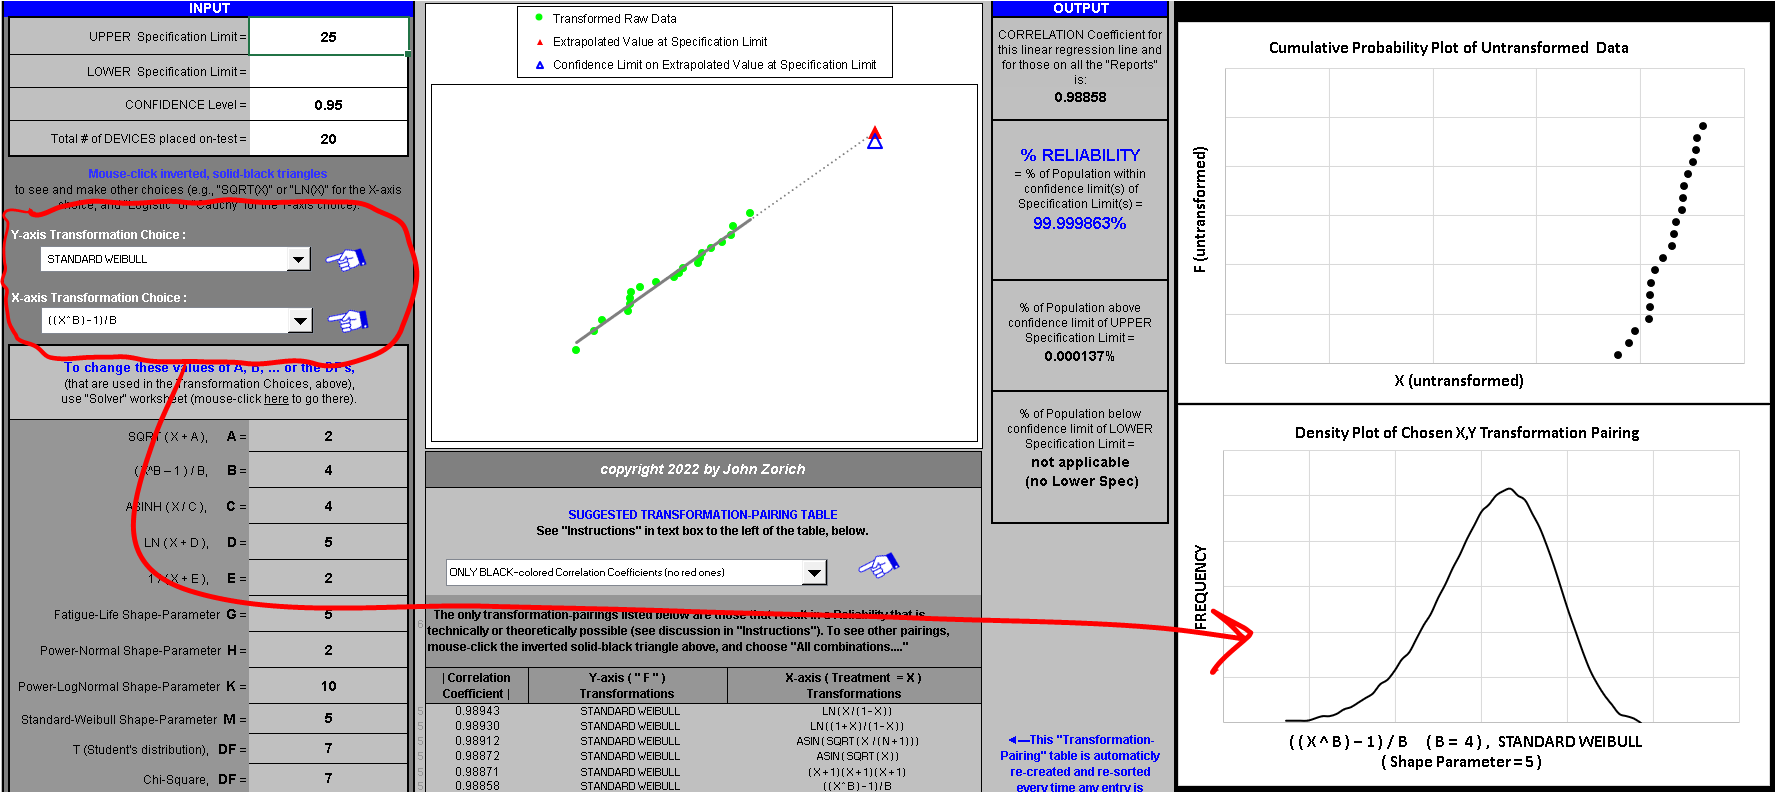
Version 13 — This program calculates %Reliability (= % In-specification) and %Confidence for all types of variable-data distributions, including data that is extremely non-normal and cannot be transformed to normality. A customizable printable test report is automatically generated. A new feature allows the user to see the shape of the chosen distribution (see image to the left of here). Additionally, drug or biologics expiration dating can now be estimated, typically resulting in longer shelf life than when estimated using curvi-linear or non-transformed linear methods. SIGNED VALIDATION REPORT IS PROVIDED FREE WITH PURCHASE ($250). Purchased by 97 companies since 2001.
Normality Tests & Normality Transformations
Version 4 —This program determines if data is normally distributed or not. It provides 10 tests of normality and helps identify which transformation to normality is best. A customizable printable test report is automatically generated. SIGNED VALIDATION REPORT IS PROVIDED FREE WITH PURCHASE ($185). Purchased by 42 companies since 2010.
Variables Data SPC
Version 8 — This program creates the following control charts: XbarR, XbarS, XmR, 3-way. It assesses data normality and calculates Cp, Cpk, Pp, and Ppk based on the original data or on transformations chosen by the user. SIGNED VALIDATION REPORT IS PROVIDED FREE WITH PURCHASE ($195). Purchased by 46 companies since 2007.
Count Data SPC
Version 4 — This program creates the following control charts: P, nP, U. It also creates a Pareto Chart of the failure types. Perfect for use in complying with CE-marking requirements for identification of “significant increase” in frequency of complaints. SIGNED VALIDATION REPORT IS PROVIDED FREE WITH PURCHASE ($195). Purchased by 28 companies since 2004.
Statistical Analysis of Gages (Metrology)
Version 5 —This program performs calculations for the following studies: Gage R+R, Gage Correlation, Gage Bias, Gage Linearity, and calculates specification Guard Bands. Customizable printable test reports are automatically generated. SIGNED VALIDATION REPORT IS PROVIDED FREE WITH PURCHASE ($185). Purchased by 28 companies since 2001.
Power Curves for T-tests
Version 2 — This program creates the following power curves: Power vs. Sample Size, Power vs. Alternative Hypothesis; Power vs. Alpha; Power vs. Standard Deviation. SIGNED VALIDATION REPORT IS PROVIDED FREE WITH PURCHASE ($75). Purchased by 25 companies since 2003.
C=0 Attribute Sampling plan
Version 4 — This program calculates the smallest C=0 sample size needed for a wide range of user-specified lot quality, LQL or AQL, as well as AOQL. Charts created are: Lot Size vs. Sample Size, Lot Size vs. Pass Rate, Lot Size vs. AOQ, and OC curve. SIGNED VALIDATION REPORT IS PROVIDED FREE WITH PURCHASE ($75). Purchased by 18 companies since 2001.
MDD Plus Sampling Plan
Version 2 —This program calculates the smallest C=0 sample size needed for a limited range of user-specified lot quality. Charts created are: Lot Size vs. Sample Size, and OC curve. SIGNED VALIDATION REPORT IS PROVIDED FREE WITH PURCHASE ($75). Purchased by 11 companies since 2009.